
Contents
- Start with the experience layer
- The control plane: configuration and intent
- The data plane: move, store and query
- The model plane: local inference as a separate service
- Logical architecture is not the same as physical topology
- Questions to resolve before production
- Engineering takeaway
- Further reading
- The capture path: snapshot first, then changes
- Database support requires source-specific preparation
- Choose Mirror or History mode based on the analytical question
- Kafka is a boundary, not a guarantee by itself
- Keep CDC delivery semantics distinct from streaming-flow semantics
- Schema evolution and rejected events need an operating policy
- Monitor the full chain
- Engineering takeaway
- Further reading
- Start with selected data context
- Draft, validate and ask for approval
- AI assistance extends into data engineering
- Model Hub separates task intent from model deployment
- GPU planning is a capacity exercise
- Local inference needs a documented data path
- Evaluate the full request path
- Engineering takeaway
- Further reading
VEDACLOUD.AI / PRODUCT ENGINEERING
A four-part technical blog series for the VedaAnalytics launch
SERIES CONTENTS
- Inside VedaAnalytics: A Self-Hosted Lakehouse with Separate Control, Data and Model Planes
- VedaFlow in Practice: From Visual Pipeline Graph to Reproducible Data Run
- CDC Without Confusion: Using Debezium and Kafka to Keep Lakehouse Data Current
- Local AI in the Analytics Loop: How VedaAI and Model Hub Work Together
Inside VedaAnalytics: A Self-Hosted Lakehouse with Separate Control, Data and Model Planes
An enterprise analytics platform is more than a query engine attached to object storage. It has to coordinate users, connectors, workflows, catalog operations, query execution, model runtimes and operational controls. Those responsibilities are related, but they are not the same workload and they do not have the same failure modes.
VedaAnalytics is organised around three logical responsibilities: a control plane for configuration and operational intent, a data plane for ingestion and analytical processing, and a model plane for local model serving. This separation makes the architecture easier to reason about while allowing the physical deployment to be shaped around the customer environment.
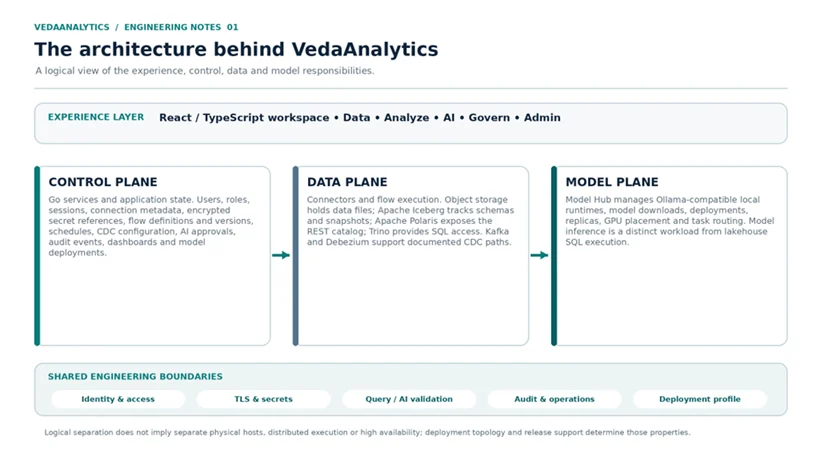
Figure 1. The VedaAnalytics logical architecture: experience, control, data and model responsibilities, with shared engineering boundaries.
Start with the experience layer
The web workspace provides task-oriented areas for Data, Analyze, AI, Govern and Admin. The client is implemented with React and TypeScript, while Go services provide application APIs and coordinate platform operations.
The experience layer is the entry point, not the data engine itself. A user can create a flow, inspect a dataset, ask a natural-language question or administer a model deployment from the workspace, but each action crosses into the service responsible for that operation.
The control plane: configuration and intent
The control plane stores and manages the information that describes how the platform should behave. That includes users, roles and sessions; connection metadata and encrypted secret references; flow graphs, versions, schedules and run metadata; CDC definitions and status; dataset and catalog operations; AI plans, approvals and audit events; model runtime inventory and task routes; and dashboard definitions and sharing configuration.
The documented architecture identifies PostgreSQL as the primary control-plane database. SQLite is used in development and embedded or test contexts. The exact metadata database and migration behaviour are determined by the deployed release.
The key design point is that configuration and intent should remain distinct from the analytical files being processed. A flow definition is not the same thing as its output table; a model deployment record is not the model process; and an audit event is not the underlying business data.
The data plane: move, store and query
The data plane connects source systems to analytical storage and query. Source adapters discover and read records. VedaFlow describes transformation graphs and the selected execution profile runs them. The lakehouse write path stores data files in object storage and commits Iceberg metadata through the configured catalog path.
Apache Iceberg provides the table format and metadata model, including schemas, partition specifications, snapshots and data-file membership. Apache Polaris provides the Iceberg REST catalog interface used to resolve namespaces and tables. Trino provides SQL query execution over the lakehouse. In a typical read path, VedaAnalytics validates the requested SQL, Trino resolves the catalog, reads the required object-store files and returns the results.
For documented CDC paths, Debezium Server captures database changes and publishes them through Kafka before VedaAnalytics applies them to lakehouse tables. Kafka is an event-transport boundary; it does not remove the need to design retention, offset persistence, replay and destination recovery.
The model plane: local inference as a separate service
The Model Hub manages locally hosted model runtimes, including the documented Ollama integration. Administrators can browse model metadata, download model artifacts, create deployments and replicas, assign runtimes to GPUs, inspect reported hardware utilisation and route application tasks to a deployment.
The model plane is separate from analytical query execution. A GPU-backed model runtime can accelerate supported inference workloads, but it does not mean that Trino executes SQL on the GPU. Query planning and lakehouse scans remain responsibilities of the configured query engine and its deployment.
Logical architecture is not the same as physical topology
The same logical components can be mapped onto different deployment profiles. The documentation describes bundled single-host installations, deployments that use operator-managed external services, GPU-enabled hosts for local model inference, and controlled-network or disconnected environments where packages and model artifacts are staged through an operator-managed process.
A logical diagram does not, by itself, establish high availability, distributed processing or multi-site disaster recovery. Those properties depend on the physical topology, component configuration, storage choices, recovery procedures and the tested support of the target release.
Questions to resolve before production
Which services are bundled and which are externally managed? Where are object storage, the Iceberg catalog, Trino, Kafka and model runtimes physically placed? Which service identities and credentials are used between components? What are the network egress rules? How are query and AI access controls enforced? What is the tested backup and restore sequence?
Answering these questions turns a logical component diagram into a deployment architecture that can be reviewed, operated and recovered.
Engineering takeaway
The architecture of VedaAnalytics is built around clear responsibilities rather than a single opaque execution tier. The control plane manages intent, the data plane moves and queries governed analytical data, and the model plane serves configured AI workloads. The strongest deployment design is the one that makes the boundaries, dependencies and operational assumptions explicit.
Inside VedaAnalytics: A Self-Hosted Lakehouse with Separate Control, Data and Model Planes
An enterprise analytics platform is more than a query engine attached to object storage. It has to coordinate users, connectors, workflows, catalog operations, query execution, model runtimes and operational controls. Those responsibilities are related, but they are not the same workload and they do not have the same failure modes.
VedaAnalytics is organised around three logical responsibilities: a control plane for configuration and operational intent, a data plane for ingestion and analytical processing, and a model plane for local model serving. This separation makes the architecture easier to reason about while allowing the physical deployment to be shaped around the customer environment.
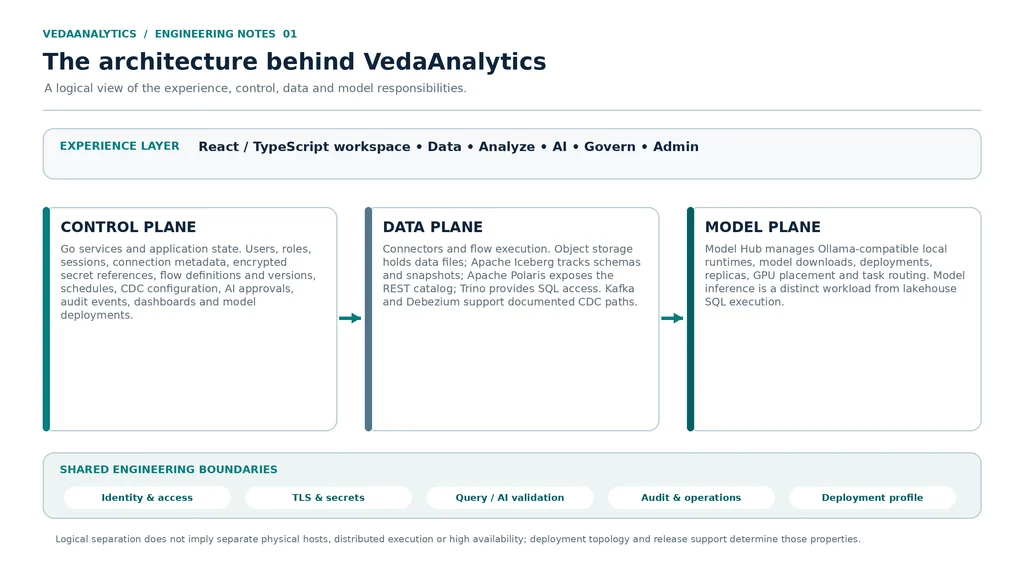
Figure 1. The VedaAnalytics logical architecture: experience, control, data and model responsibilities, with shared engineering boundaries.
Start with the experience layer
The web workspace provides task-oriented areas for Data, Analyze, AI, Govern and Admin. The client is implemented with React and TypeScript, while Go services provide application APIs and coordinate platform operations.
The experience layer is the entry point, not the data engine itself. A user can create a flow, inspect a dataset, ask a natural-language question or administer a model deployment from the workspace, but each action crosses into the service responsible for that operation.
The control plane: configuration and intent
The control plane stores and manages the information that describes how the platform should behave. That includes users, roles and sessions; connection metadata and encrypted secret references; flow graphs, versions, schedules and run metadata; CDC definitions and status; dataset and catalog operations; AI plans, approvals and audit events; model runtime inventory and task routes; and dashboard definitions and sharing configuration.
The documented architecture identifies PostgreSQL as the primary control-plane database. SQLite is used in development and embedded or test contexts. The exact metadata database and migration behaviour are determined by the deployed release.
The key design point is that configuration and intent should remain distinct from the analytical files being processed. A flow definition is not the same thing as its output table; a model deployment record is not the model process; and an audit event is not the underlying business data.
The data plane: move, store and query
The data plane connects source systems to analytical storage and query. Source adapters discover and read records. VedaFlow describes transformation graphs and the selected execution profile runs them. The lakehouse write path stores data files in object storage and commits Iceberg metadata through the configured catalog path.
Apache Iceberg provides the table format and metadata model, including schemas, partition specifications, snapshots and data-file membership. Apache Polaris provides the Iceberg REST catalog interface used to resolve namespaces and tables. Trino provides SQL query execution over the lakehouse. In a typical read path, VedaAnalytics validates the requested SQL, Trino resolves the catalog, reads the required object-store files and returns the results.
For documented CDC paths, Debezium Server captures database changes and publishes them through Kafka before VedaAnalytics applies them to lakehouse tables. Kafka is an event-transport boundary; it does not remove the need to design retention, offset persistence, replay and destination recovery.
The model plane: local inference as a separate service
The Model Hub manages locally hosted model runtimes, including the documented Ollama integration. Administrators can browse model metadata, download model artifacts, create deployments and replicas, assign runtimes to GPUs, inspect reported hardware utilisation and route application tasks to a deployment.
The model plane is separate from analytical query execution. A GPU-backed model runtime can accelerate supported inference workloads, but it does not mean that Trino executes SQL on the GPU. Query planning and lakehouse scans remain responsibilities of the configured query engine and its deployment.
Logical architecture is not the same as physical topology
The same logical components can be mapped onto different deployment profiles. The documentation describes bundled single-host installations, deployments that use operator-managed external services, GPU-enabled hosts for local model inference, and controlled-network or disconnected environments where packages and model artifacts are staged through an operator-managed process.
A logical diagram does not, by itself, establish high availability, distributed processing or multi-site disaster recovery. Those properties depend on the physical topology, component configuration, storage choices, recovery procedures and the tested support of the target release.
Questions to resolve before production
Which services are bundled and which are externally managed? Where are object storage, the Iceberg catalog, Trino, Kafka and model runtimes physically placed? Which service identities and credentials are used between components? What are the network egress rules? How are query and AI access controls enforced? What is the tested backup and restore sequence?
Answering these questions turns a logical component diagram into a deployment architecture that can be reviewed, operated and recovered.
Engineering takeaway
The architecture of VedaAnalytics is built around clear responsibilities rather than a single opaque execution tier. The control plane manages intent, the data plane moves and queries governed analytical data, and the model plane serves configured AI workloads. The strongest deployment design is the one that makes the boundaries, dependencies and operational assumptions explicit.
Further reading
- VedaAnalytics repository and technical documentation
- DuckDB documentation
- Apache Spark documentation
- Apache Beam documentation
CDC Without Confusion: Using Debezium and Kafka to Keep Lakehouse Data Current
A technical walkthrough of snapshots, log capture, event transport, replication modes and recovery considerations.
Batch ingestion and change data capture solve different problems. A batch load reads a source at a point in time or on a schedule. Change Data Capture (CDC) reads changes from transaction logs or database change streams so that a destination can be updated as the source changes. Streaming ingestion handles continuously arriving messages from supported event sources, often in short micro-batches.
VedaAnalytics documents a CDC path built around Debezium Server, Kafka and VedaAnalytics change application. Understanding the boundaries between those components is essential: source capture, event transport and destination commits have different configuration and recovery requirements.
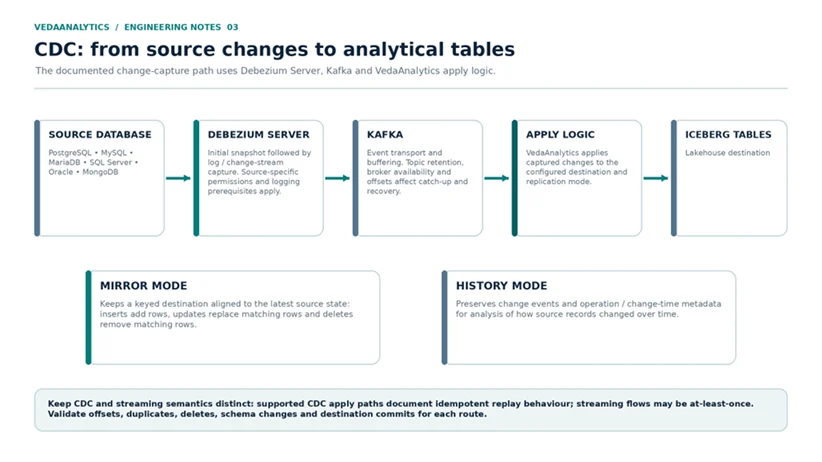
Figure 1. The documented CDC path separates source capture, Kafka event transport and destination apply logic.
The capture path: snapshot first, then changes
The CDC lifecycle begins with source configuration. The database must expose the required logs or change stream, the connector needs appropriate permissions, and the replication definition must identify the schemas and tables to capture. Once prerequisites are validated, the initial snapshot loads the current source state. The connector then transitions to ongoing change capture.
Debezium Server captures the changes and publishes them to Kafka. VedaAnalytics consumes the supported change events and applies them to the selected lakehouse destination. Kafka separates the capture process from destination application and provides a buffer, subject to broker availability, topic retention and offset management.
Database support requires source-specific preparation
The technical documentation describes CDC workflows for PostgreSQL, MySQL, MariaDB, SQL Server, Oracle and MongoDB. The exact setup is not identical across those systems. Logging configuration, replication settings, permissions, connector behaviour and source-side retention must be validated for the database and connector version in the target release.
Batch-read support and CDC support are separate capabilities. A database connection that can read rows does not automatically mean that its log-based replication path is configured or ready for production. Validate the CDC prerequisites explicitly before starting a replication.
Choose Mirror or History mode based on the analytical question
Mirror mode maintains a destination table that represents the latest source state by key. Inserts create rows, updates replace the matching row and deletes remove the matching destination row. This is useful when analysts need a current-state representation of the source.
History mode preserves change events as history records. The documented model includes operation and change-time metadata such as _cdc_op and _cdc_changed_at, with offset metadata supporting history ordering. This is useful when the analytical question concerns how a record changed over time rather than only its latest state.
The mode should be selected deliberately per replication. Mirror tables and history tables answer different questions and should not be treated as interchangeable representations.
Kafka is a boundary, not a guarantee by itself
Kafka provides event transport and buffering between capture and apply. It can help the destination catch up after a temporary slowdown, but only within the configured retention and operational limits. A source outage, broker outage or destination outage can affect the time required to resume processing.
Plan topic retention around the expected outage and catch-up window. Monitor source log or replication-slot growth as well as Kafka disk usage and topic retention. A long-lived source replication position can consume database resources if it is not monitored. Offset persistence and destination commit ordering must also be understood for the chosen deployment.
Keep CDC delivery semantics distinct from streaming-flow semantics
The documentation describes an idempotent apply and replay design for supported CDC paths. It describes streaming-flow processing separately, with at-least-once semantics. Those statements should not be collapsed into a single platform-wide delivery guarantee.
For each source and destination combination, test offset persistence, commit order, replay behaviour, duplicate suppression, delete and truncate handling, schema changes, connector restart behaviour and destination outage recovery. A retry that is safe for one path may not be safe for a different connector or destination.
Schema evolution and rejected events need an operating policy
Event schemas change. A production design should decide whether new fields are accepted, how type changes are handled, how removed fields are represented and whether incompatible events are quarantined. It should also define how downstream tables, dashboards and queries are reviewed after a schema change.
Where the source uses a schema registry or Avro/Protobuf messages, validate the serialization format and connector support. A dead-letter design should preserve enough information to investigate and replay rejected events, including the failure reason and source offset. The retention, access policy and replay procedure should be documented.
Monitor the full chain
Useful operational signals include source log or replication-slot growth, Debezium process health, Kafka broker disk and topic retention, consumer lag, destination commit rate, table file count, Iceberg snapshot growth and restart or catch-up time. These measurements expose problems before the pipeline appears stale to a dashboard user.
CDC sizing depends on source write rate, the number of captured tables, event size, broker retention, destination commit latency and the selected Mirror or History mode. Establish alert ownership and recovery runbooks for the source, capture service, broker and destination apply path.
Engineering takeaway
Reliable CDC is a chain of explicit contracts: source capture prerequisites, event transport and retention, offsets, destination write semantics and a tested replay procedure. Debezium and Kafka provide important building blocks, but the delivery and recovery behaviour must be verified for each supported source and destination path.
Further reading
- VedaAnalytics repository and technical documentation
- Debezium documentation
- Apache Kafka documentation
- Apache Iceberg documentation
Local AI in the Analytics Loop: How VedaAI and Model Hub Work Together
From a natural-language question to a reviewed query, with locally hosted models and explicit resource management.
Adding a language model to an analytics product is not simply a matter of connecting a chat box to a database. A useful system needs to understand which datasets are in scope, ground its suggestions in the available schema, validate the proposed action and let the user review the result before execution.
VedaAnalytics combines VedaAI with the Model Hub. VedaAI provides natural-language assistance in analytics and engineering workflows; the Model Hub manages configured model runtimes and routes tasks to them. The query engine remains a separate part of the system.
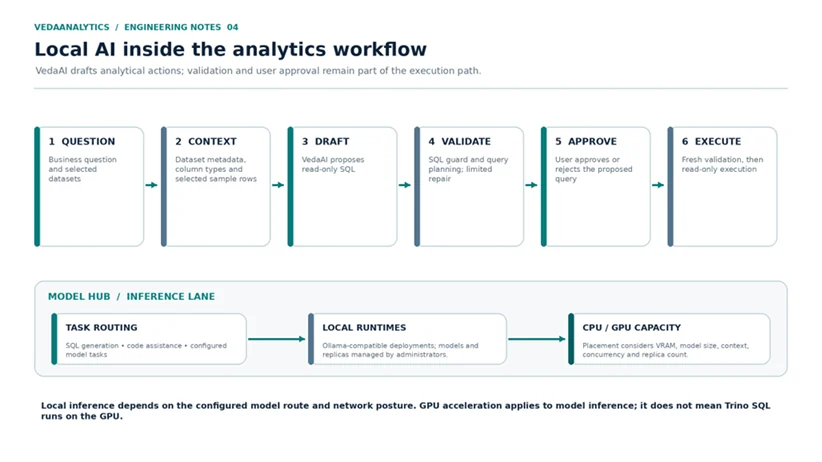
Figure 1. VedaAI places schema grounding, SQL validation and user approval between a natural-language question and read-only query execution.
Start with selected data context
Ask Veda translates a business question into a query draft using the selected dataset context. The documented grounding information includes dataset and table metadata, column names and types, selected sample rows and the datasets explicitly chosen for the request.
This context helps a model choose relevant tables and fields, but it cannot resolve every business ambiguity. “Revenue” may mean gross sales, net sales, invoiced revenue or settled cash. A date may refer to order date, invoice date or settlement date. A one-to-many join can duplicate a measure if the intended grain is not clear.
For important analytical concepts, define certified metrics and business terms outside the prompt alone. A metric should have a documented grain, formula, filters, units, time basis, owner and version.
Draft, validate and ask for approval
The model does not directly execute arbitrary SQL. It drafts a query using the selected schema context. The query guard and query-engine planning path then check whether the statement is permitted and executable. Validation feedback can be supplied to the model for a limited repair attempt.
The user can approve or reject the proposed query. Approval triggers a fresh validation before read-only execution. This makes the user part of the decision path rather than treating a plausible-looking generated query as automatically safe or correct.
Before approving a query, review the table and field selection, join semantics, filters and date boundaries, metric definition, grouping and aggregation grain, expected result shape and query cost. For critical reporting, add peer review or business-owner sign-off.
AI assistance extends into data engineering
VedaAI assistance is also documented in the SQL workspace and VedaFlow nodes. Users can ask for SQL to be written, explained, improved or fixed. In a flow, the assistant can draft a filter expression or SQL/Python transformation using the node input schema context.
Generated code remains a draft. Inspect the expression, preview the transformation using representative data, compare output fields and row counts, and publish only after validation. The same discipline used for hand-written SQL and pipeline logic should apply to AI-generated logic.
Model Hub separates task intent from model deployment
The Model Hub manages locally hosted model runtimes, including the documented Ollama-compatible integration. Administrators can browse the model catalogue, download artifacts, deploy and remove model instances, add or remove replicas, assign replicas to GPUs, inspect runtime status and reported VRAM usage, and configure task routes.
Task routing decouples an application feature from one fixed model name. A deployment can be selected for supported tasks such as SQL generation, code assistance and embeddings. The catalogue describes declared model capabilities; it does not prove that a model is suitable for every task or hardware profile. Evaluate output quality and latency with representative workloads before using a route in production.
GPU planning is a capacity exercise
GPU placement depends on available memory, model size, expected runtime memory, context length, request concurrency, replica count, quantisation and driver or container configuration. VRAM fit checks are estimates: actual memory usage varies with model implementation, prompt length, batching and concurrency.
Multiple replicas assigned to the same physical GPU share its compute and memory bandwidth. Replicas can distribute concurrent requests, but they do not multiply the underlying hardware capacity. Measure requests per second, time to first token, tokens per second, queue time, VRAM utilisation, CPU and RAM use, failure rate and model warm-up time.
VedaAnalytics can also run without an NVIDIA GPU. CPU inference may suit smaller models, low concurrency or non-interactive workloads, but latency depends heavily on CPU capability, memory bandwidth, quantisation and request length.
Local inference needs a documented data path
When VedaAI is configured to use a local model runtime, prompts and inference can remain inside the configured infrastructure boundary. That is a deployment property, not an automatic consequence of installing the product. The actual data path depends on which datasets and sample rows are sent to the model, where the runtime is placed, network egress rules, telemetry and logging configuration, and whether external model providers are enabled.
For each production task route, document the model name and version, licence, runtime location, hardware placement, network posture, task purpose and evaluation results. Review commercial-use terms, redistribution obligations and provenance before deploying a model.
Evaluate the full request path
Model quality is only one part of the experience. Evaluate whether the correct datasets are selected, whether generated SQL uses the right fields and joins, whether validation catches invalid or unsafe statements, whether the user can understand the proposed query, and whether the result matches a known test case.
Also measure end-to-end latency, queue time, model warm-up, token throughput, query planning and execution time, and runtime resource usage. This gives operators a more complete picture than a model benchmark alone.
Engineering takeaway
The engineering value of local AI comes from the complete workflow: dataset grounding, careful query drafting, policy validation, human approval, read-only execution and a model-serving layer whose hardware and network placement are understood. VedaAI assists the user; the query guard, configured runtime and human review remain essential parts of the system.
Further reading
- VedaAnalytics repository and technical documentation
- Ollama documentation
- NVIDIA Container Toolkit
- Trino documentation
Editorial note: This article is based on the VedaAnalytics technical documentation review baseline dated 1 November 2026. Component availability, connector behaviour and deployment topology should be checked against the exact product release being deployed.
Downloads
Was this article helpful?